Practical 4: Pump Performance
Introduction

Design of pumped systems involves the careful selection of a pump (or group of pumps) to deliver the required flow rate at the required head. Lack of care can lead to a variety of problems, including pumps delivering insufficient flow, consuming more energy than necessary or causing excessive wear due to operating outside the pump’s “preferred” zone of head or flow.
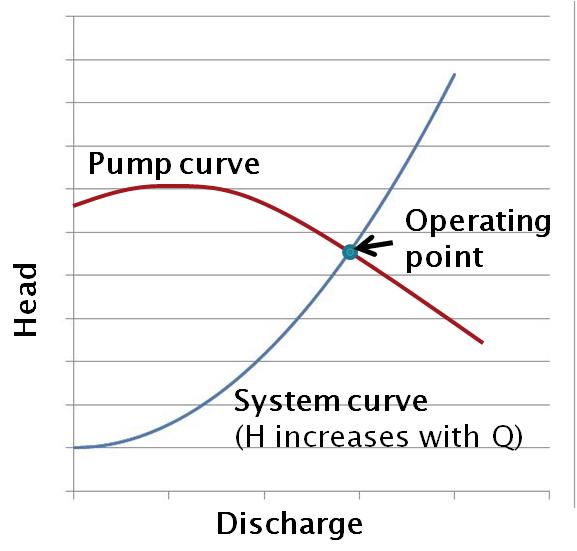
The flow rate delivered in a pumped system is given by the intersection point between two curves: the pump curve and the system curve.
The pump curve
Pumps are built to operate over a specific range of total head (H) and flow rate (Q). The typical H-Q relationship for a pump is a curve connecting two points from a maximum value of H (at which flow Q drops to zero) to a maximum theoretical flow rate Q (at which there is no head H).
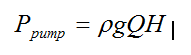
The hydraulic pumping power (Ppump) is given by:
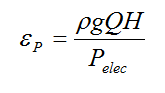
The electric motor driving the pump consumes energy at a rate Pelec, and the resultant efficiency of the motor-pump combined unit is given by:
Generally, pumps are designed with a rated head and discharge called the “design point”, corresponding to the specific H-Q combination that gives maximum efficiency (see figure 11.17 below, from Hamill 2011). Pumping at either a higher head (lower flow) or higher flow (lower head) yields sub-optimal efficiency and depending on the pump, the efficiency of pumping away from the rated head and discharge may be extremely low, leading to a great deal of wasted energy.
Supporting Information
The system curve
Like pumps, a pipe system has a distinct H-Q relationship, because as flow increases, friction head losses increase. There is also a “static” (elevation/lift) head component in pumped systems. In low flow, high lift and/or short wide pipe situations the static head may dominate and the total head is not significantly dependent on flow rate. However, for high flow and/or long thin pipelines, the friction head losses can be significant and are heavily dependent on flow rate.
The basic H-Q relationship for a pipe or pipe network is called the “system curve” and the total head HT is given by:
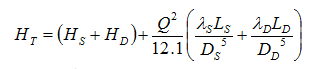
where HS and HD are the static lift (m), and are the Darcy friction coefficients, LS and LD are the pipe lengths (m) and DS and DD are pipe diameters. Subscripts S and D denote the suction and delivery lines, respectively. Note the strong dependence on pipe diameter in this equation. In the equation above, minor losses have been neglected.
For a pumped system, we find the “operating point” by determining the intersection between the pump curve and system curve (see figure, left). This is the head and flow-rate at which the system is expected to operate. Appropriate pump selection involves aligning (as best as possible) the operating point to the pump’s design point.