Practical 7: Symbolic Toolbox
Practical 7
Plotting Functions
Table for Comparison of 3 Graph Plotting Functions
| Command | plot | fplot | ezplot |
| Required inputs |
|
|
|
| Advantages |
does not need a function formula
full control of graph parameters
|
|
|
| Disadvantages |
|
|
|


|
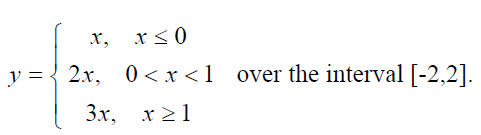
Example: Create a graph of the function
Which plot command would you use? Answer: The answer depends on your overall task. If you will need this function for further calculations, then use fplot command. To use fplot, you will need to create a function M-file, specifying the three parts of the function separately by using if statements. If you want just to plot this function, then use ezplot with hold on and hold off commands to plot it ‘piece-by-piece’, specifying endpoints. clear all syms x hold on ezplot(x,[-2, 0]) ezplot(2*x,[0, 1]) ezplot(3*x,[1, 2]) axis([-2 2 -2 6]) %why do you need to do this? title(‘Piece-wise function’) %what changes will happen if you delete this command? hold off |
|
|
|
Quickly check that the equation Hint: use ezplot. |
|
> Exercise: Graphing > In the table below you are given the results of a student’s weekly assignments to plot. > Which graphing technique would you use in this case? |
 Note: If you plot several functions using
 ")

| Week | 1 | 2 | 3 | 4 | 5 | 6 | 7 | 8 | 9 | 10 | 11 | 12 |
| Grade | 88 | 97 | 100 | 49 | 76 | 33 | 100 | 88 | 87 | 63 | 10 | 82 |