Practical 2 - Flow Measurement
| Site: | learnonline |
| Course: | Introduction to Water Engineering |
| Book: | Practical 2 - Flow Measurement |
| Printed by: | Guest user |
| Date: | Monday, 25 May 2026, 9:21 AM |
Description
Practical 2 - Flow Measurement
Introduction
The measurement of flow in hydraulic systems may be divided into two broad categories:
- flows in pipes or conduits, and
- flows in open channel device.
In this experiment five commonly used devices (four conduit and one open channel) will be calibrated for water flow. Use the 360 panorama to view the pipe flow rig for this experiment in the laboratory at Mawson Lakes.
Apparatus
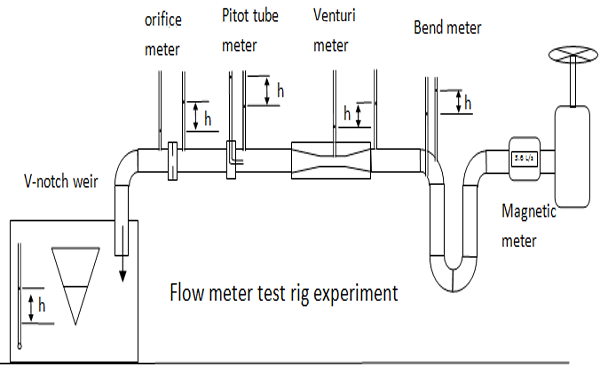
In this practical, water flows through a pipe (Nominal pipe diameter = 80 mm) containing a series of different devices.
The first is a magnetic meter, which is simply used to provide an accurate measurement of flow rate against which we will be calibrating the other devices. The next four devices in the pipe all rely on the measurement of a differential pressure which we use to infer the velocity from the energy equation.
For all of these meters, two “tapping points” have been attached to allow pressure to be measured. These are all connected by small pipes to a central manifold and differential manometer (see photos) where the readings are taken.
At the end of the pipe, water empties into a short open channel containing a V-notch weir (in this experiment, θ = 30 degrees). This provides a further opportunity to measure flow by recording the height of water above the crest. A clear plastic tube is attached to the side of the channel alongside a ruler, to provide an accurate reading of water level.
The individual devices are:
1. Bend meter – this simple device relies on the water moving at different velocities on the inside and outside of a bend. From the energy equation we know that this difference in velocity will correspond to a measurable pressure difference.
2. Venturi meter – this is a classic flow measurement device, where water is passed through a narrow throat (throat diameter = 38 mm) in order to induce a higher velocity. Pressure is measured upstream and in the throat, to give the two values corresponding to high and low velocity.
3. Pitot tube – this device is useful for measuring high flows as it results in minimal disruption to the flow. A tube is inserted into the flow such that the water at the entrance of the tube stagnates. The pressure measured in this tube (the “stagnation pressure”) is equal to the pressure head plus velocity head. By comparing against a measurement of pressure head (“static pressure”) taken in the main flow field nearby, the difference between these measurements will be the velocity head.
4. Orifice meter – this is like a crude version of a Venturi meter and follows exactly the same principles by forcing water through a smaller section. The only physical difference between the two devices is that the orifice is simply a flat plate (perpendicular to the direction of the flow) with a hole in it (orifice diameter 26 mm), whereas a Venturi contains a gradual contraction and expansion. The result of this is that the orifice meter induces a far great pressure difference (and head loss) for a given velocity.
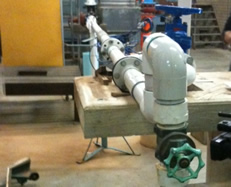
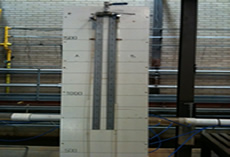
These images are of the rig for the pipe flow experiment showing the conduit (left) and the manometer (right).
Experimental method

In this experiment, flow rate, Q, is measured using a magnetic flow meter, located at the upstream end of the experimental rig and head, h, is measured using a differential manometer.
STEP 1
Observe that with NO FLOW, there is zero pressure head difference indicated by the manometers connected to station pairs, A and B.
Note: Ensure bypass valve in the open position.
STEP 2
With a small flow passing through the bend meter, pitot tube meter and the venturi meter, observe the small pressure head difference:
(hA - hB) = h
STEP 3
Record flow rate Q from magnetic flow meter and height of water in the V-notch weir tank (see note below.
STEP 4
Repeat STEPS 2 and 3 for several different flows (up to ~4L/s), recording Q and h in each case.
STEP 5
Repeat STEPS 1 - 4 inclusive for flow passing through the orifice plate. The pressure differences are more sensitive, so the test flow rates will need to be less (up to ~1 L/s).
Note: turn bypass valve in the closed position to force flow through the orifice!
Data for Analysis
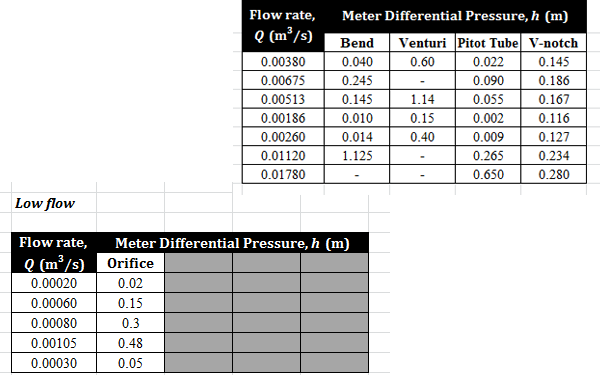
Please download this spreadsheet to obtain data for this experiment.
Supporting Information
Bend meter
(Cd ~ 0.60 for comparison with experimental value)
Nominal pipe diameter = 80 mm
Q = Cd x a x √(2g) x h0.5
Venturi meter
(Cd ~ 0.97 for comparison with experimental value)
Approach pipe diameter = 80 mm and throat diameter = 38 mm
Q = Cd x a1 x √(2g/(k2 – 1)) x h0.5
Where k = a1/a2 (a1 and a2 is the upstream pipe and throat diameter, respectively)
Pitot tube meter
(Cd ~ 0.99 for comparison with experimental value)
Nominal pipe diameter = 80 mm
Q = Cd x a x √(2g) x h0.5
Orifice meter
(Cd ~ 0.66 for comparison with experimental value)
Approach pipe diameter = 80 mm and throat diameter = 26 mm
(Discharge equation identical to Venturi)
Calculations
- Plot the discharge relationship for each device in Excel and determine the equation using a “power” type trendline.
- Determine k and n values for each device from the trendline.
- Re-calculate k using least-squares, by setting n = 0.5 (use Solver to minimise total error by changing the value of k)
- Using the two values of k (from trendline and Solver), derive the value of Cd from the discharge equation for each device as shown below. Approximate expected values of Cd are also provided below for comparison with your results.
- Comment on the results, and in particular how the results compared to expected values for Cd.
Supporting Information
For each device, you will need to look at the discharge equation (see equations for each device, listed below) in the form Q = khn and then, using the “k” values obtained from the procedure on the left, rearrange the discharge equation to solve for Cd.
Bend meter, (Cd ~ 0.60 for comparison with experimental value)
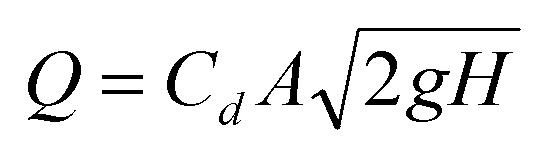
where A is the cross-sectional area of the pipe (use nominal diameter given in the Apparatus section) and H is the difference in pressure head measured on the inside and outside of the bend.
Venturi meter, (Cd ~ 0.97 for comparison with experimental value)
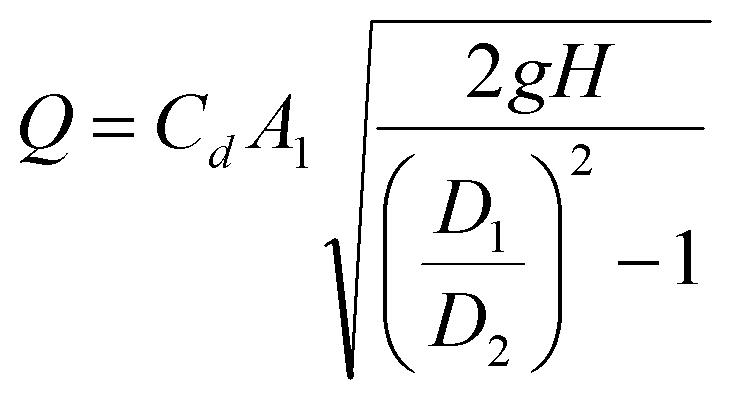
where A1 is the upstream cross-sectional area of the pipe (use nominal diameter given in the Apparatus section), H is the difference in pressure head measured on the inside and outside of the bend, D1 is the upstream pipe diameter and D2 is the diameter in the throat (see Apparatus section).
Pitot tube meter (Cd ~ 0.99 for comparison with experimental value)
where A is the cross-sectional area of the pipe (use nominal diameter given in the Apparatus section) and H is the difference between the stagnation pressure and the static pressure.
Orifice meter (Cd ~ 0.66 for comparison with experimental value). Discharge equation identical to Venturi
Triangular weir (Cd ~ 0.6 for comparison with experimental value)
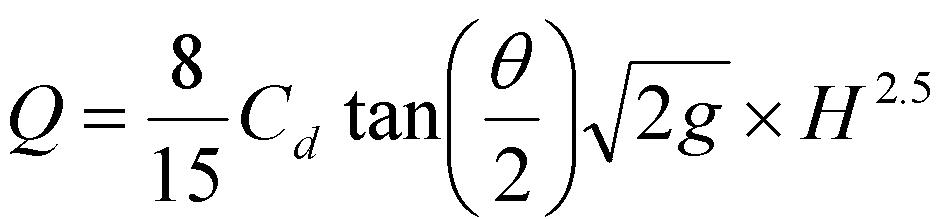
where θ is the weir angle and H is the height of water above the crest.