Practical 2: Variables, Script M-files and Graphing
| Site: | learnonline |
| Course: | MATLAB |
| Book: | Practical 2: Variables, Script M-files and Graphing |
| Printed by: | Guest user |
| Date: | Saturday, 21 March 2026, 8:08 PM |
Description
MATLAB Short Course
Practical 2
Variables, Script M-files and Graphing
|
1. Understand the purpose of variables and how to create variables 2. Write a script M-File (a list of MATLAB commands, saved in a file) with an emphasis on using appropriate comments 3. Learn how to plot a graph
|
Working through this Practical
Go through this practical at your own pace and learn about the MATLAB environment in more detail.
- The exercises are indented and on separate pages with shaded areas. Do these!
- Ask your MATLAB eTutor if you have any questions or need advice using the Practical's Forum
- MATLAB code will always be denoted by the Courier font.
- An arrow > at the start of the line in an exercise indicates an activity for you to complete.
- Use the arrows on the top right and bottom right of this display to move between pages, or select a page using the left hand navigation pane.
- You can also print this resource as a single document (using the print icon in 1.9 or the Admin section in 2.5/2.6).
Please submit your responses to the activities within this practical for formative feedback from your MATLAB eTutor. This word document template can be used to prepare your responses for submission.
Naming of Numerical Values in MATLAB
Why would we want to name numerical values? Here is one example: Consider the polynomial function
 to be calculated for x = 3.
We could do so by typing in the following:
3^2 + 4*3 + 3
but what if we also want to know the answer when  = 7 and = 5? Wouldn’t it be easier to create a name for 3 called as follows:
x = 3
and then evaluate our polynomial function by typing in:
x^2 + 4x + 3
x is what we call a variable.
Using Variables
Consider the polynomial function to be calculated for various values.
|
> Type in x^2 + 4x + 3 to set the value of x equal to 3 and then evaluate the value of the polynomial y. Warning: The above code contains an error that is commonly made by learners. > What is the error? > Change the value of x to evaluate the polynomial for x = 5 and 7. You will need to re-run the command to solve the polynomial each time you update x. |
 Coding Reminder: The up-arrow on the keyboard will recall a previous line for you to edit. Coding Reminder: The up-arrow on the keyboard will recall a previous line for you to edit. |
Variables
Variables must be assigned values in the following format before they can be used in an expression.
<variable name> = <valid expression>
| Tip: Angular brackets <> will be used to represent something generic that will be replaced in a specific example. |
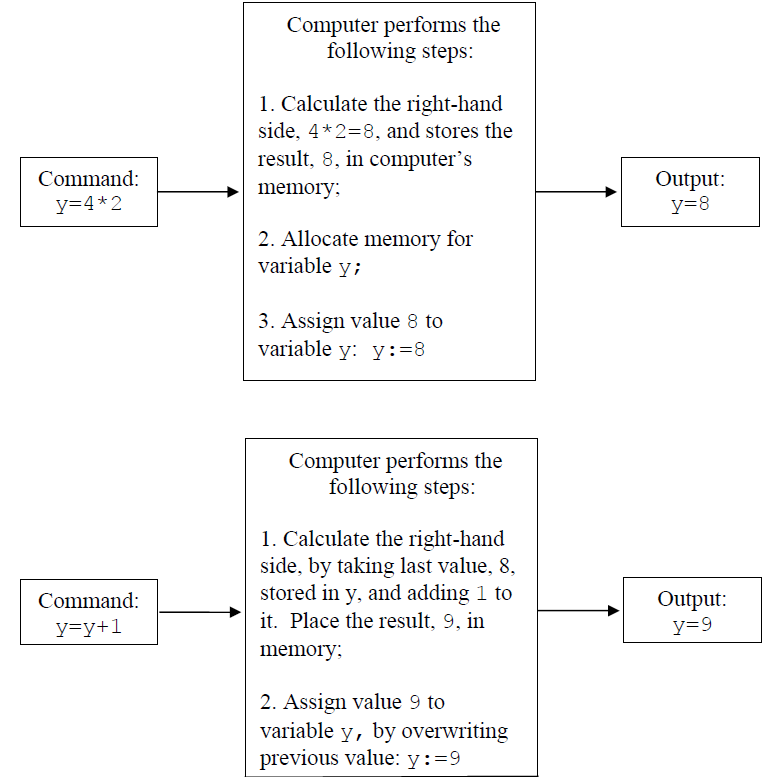
What this statement means is that the left hand side of an equals sign is always a variable name, say, x. The right hand side is an expression representing a new value to be assigned to that variable.
What is valid?
|
> Type in the following examples exactly as written to see what is a <valid expression> and <variable name>. > Check what happens in your Workspace Window when you create and update your variables. x=1+4 Valid? Y/N Reason (if invalid) x=1+2+...+10 Valid? Y/N Reason (if invalid) x+1=7 Valid? Y/N Reason (if invalid) x=2(6) Valid? Y/N Reason (if invalid) bigX=x+1 Valid? Y/N Reason (if invalid) x=newX+1 Valid? Y/N Reason (if invalid) x=x+1 Valid? Y/N Reason (if invalid)
|
|
The last example shows an important concept: a variable can refer to itself to be given a new value. |
Naming variables
The following commands illustrate the order of priority when evaluating expressions.
|
A love-struck engineer specialising in planning the foundations of a building wrote the following code to calculate the area of a rectangle. > Determine what each variable represents and then rename the variables to write the new code in MATLAB with meaningful variable names. dinner = 4 nice = 7 roses = dinner*nice |
|
The preferred naming convention is to capitalise the start of each new word, as in ThisIsALongVariable however some people prefer to separate words with underscores, as in this_is_a_long_variable. |
Functions
|
> Use MATLAB to evaluate the following functions at the given values of x. Type in the command clear x beforehand.
|


Comments in MATLAB
When we write a code, it is helpful to add comments to describe or explain the purpose of one or more lines of code. Conveniently, the symbol % lets us add text that will be read only by users, not by MATLAB. All characters, letters and words after a percent (%) sign on a given line are ignored, and not executed.
Exercise
|
> Type in the following line (including the comment): t = 9 % sets time variable equal to 9 > Then add a comment to the next line, which finds the acceleration at time t. a = 15*sqrt(t) % <add your comment here>
|
Comments as good coding practice
Soon, the code you will be able to write will become much more complicated. You will need to add comments to make it easier for both you and others to read.
Script M-files
A script M-file allows you to place MATLAB commands in a simple text file and then tell MATLAB to open the file and execute all commands precisely as if you had typed them at the Command Window prompt.
Script M-files must have file names ending with extension ‘.m’ and must contain only valid MATLAB code.
Exercise
|
> Open a new script M-file by clicking on New Script while in Home tab. A new window will be opened. It has three tabs: Editor, Publish and View. To create, save, run, and edit your M-file you need to stay in the Editor tab. > From now on every M-file should start with comment headers that include your name and student ID as well as a description of the purpose of the code as follows: % Practical 2 Graphing exercise % <Add your name, student ID and today’s date here> > Add in the commands: clear all x=2^3 > Save your M-file, for example, as prac2e1.m in your preferred directory and make sure that the Current Folder in MATLAB is set to the same location. > Enter command prac2e1 (or whatever name you saved your M-file as) in the Command Window. It should execute your M-file code. Please, note absence of the file extension .m |
|
|
| Coding tip: You can also click on the Run mode or press F5 key while having MATLAB M-file Editor window open. Your M-file will be saved and executed. To see the output you will need to return to the Command Window. |
Plotting Graphs
There are several ways to plot graphs in MATLAB. We will start by using the plot command to create a simple straight line graph by providing two sets of coordinates
![\left(\left[x_{1} x_{2}\right],\left[y_{1} y_{2}\right]\right)](https://lo.unisa.edu.au/filter/tex/pix.php/9da1359b34896b466a091126b27fa2e7.gif "\left(\left[x_{1} x_{2}\right],\left[y_{1} y_{2}\right]\right)")
defining the start and end points, ") and
and ") , respectively.
, respectively.
Exercise
|
> Create and run a script M-file called plotMe.m for the following command. Remember to add your comment headers at the top. plot([1 3], [2 5]) Note: The graph will appear in a separate Figure Window named Figure 1 that is often hidden behind the main MATLAB window. Maximise it on your taskbar if it does not pop up. > What does the graph look like? Verify which points of 1, 2, 3, 5 are
|
|
> Modify your plotMe script M-file to plot the functions
|


")


Graph Commands
| Table of the most useful commands for plotting graphs | |
| hold on | Allows plotting several graphs on the same figure. All commands after this one apply to a current figure, until the hold off command is used. |
| plot([x1 x2], [y1 y2]) | plots the straight line between points ( , ,  ) and ( ) and ( , ,  ) ) |
| axis([minX maxX minY maxY]) | specifies axis limits |
| legend(‘y1=equation1’, ‘y2=equation2’) | sets the labels for the legend (must be after plot command) |
| xlabel(‘label for x axis’) | sets the label for the - axis |
| ylabel(‘label for y axis’) | sets the label for the  - axis - axis |
| title(‘graph title’) | sets the label for the title |
| hold off | Following commands no longer apply to the current figure. |
Exercise
|
> Modify your script M-file, plotMe to specify an appropriate axis, legend, labels and title. Remember to use the hold on and hold off commands. > Use the help files for the plot command to change the colour of the lines. |
| Important: From now on, it is expected that every graph you make will have an appropriate title and label for both axes. |
|
> What do the following MATLAB coding terms mean? variable script M-file comment valid |
Questions?
You may also wish to discuss these questions within the Practical 2 forum, also embedded below. If you think you know the answer, you are welcome to respond.
Submit
Please submit your response to Practical 2 for feedback (also embedded below). Use this word document as a template.