Practical 3: Arrays
| Site: | learnonline |
| Course: | MATLAB |
| Book: | Practical 3: Arrays |
| Printed by: | Guest user |
| Date: | Saturday, 23 May 2026, 4:21 AM |
Description
MATLAB Short Course
Practical 3
Arrays
|
Working through this Practical
Go through this practical at your own pace and learn about the MATLAB environment in more detail.
- The exercises are indented and on separate pages with shaded areas. Do these!
- Ask your MATLAB eTutor if you have any questions or need advice using the Practical's Forum
- MATLAB code will always be denoted by the Courier font.
- An arrow > at the start of the line in an exercise indicates an activity for you to complete.
- Use the arrows on the top right and bottom right of this display to move between pages, or select a page using the left hand navigation pane.
- You can also print this resource as a single document (using the print icon in 1.9 or the Admin section in 2.5/2.6).
Please submit your responses to the activities within this practical for formative feedback from your MATLAB eTutor. This word document template can be used to prepare your responses for submission.
Arrays
An array in MATLAB is a list of objects, e.g. numbers or characters that can easily be stored and accessed. Each object or element in the array has a fixed position.Arrays are useful in MATLAB as they allow an operation to be performed on more than one number using a single command. Arrays are also important for plotting.
Creating Arrays
Try these different ways of creating arrays
|
> Type in the elements of the array one-by-one at the prompt within square brackets. Elements should be separated by commas or spaces (advantage: easy for small set of numbers, disadvantage: tedious and time consuming for lots of numbers). x1=[2, 5, 13, -1, 0.111, pi] |
|
> Create an array of integers with increment 1 (by default) from smallest to largest (advantage: fast, especially for many numbers, disadvantage: increment of 1 only) smallest= -3; largest= 24; x2= [smallest:largest] The following is also valid: x2= [-3:24] |
|
> You can also specify the increment or the step size, h. Check the following (note you must define smallest and largest first). (advantage: allows different increments, disadvantage: one must calculate number of elements). h= 0.06 x3= [smallest:h:largest] |
|
> You can specify the number of points instead of the step size using the linspace command. points= 20; x4= linspace(smallest,largest,points) |
Stopping Calculations
Ctrl+c (read: control c): command to stop execution of the code at any time. You will need to press at the same time both ‘Ctrl’ and ’c’ keys on the keyboard
; (called semi-colon): suppresses the appearance of an unnecessary output when typed at the end of the command line
|
> Type in the following command and see what happens. [1:0.0001:1000] > Press Ctrl + c to stop the calculations! > Type in the same line again, but this time add a semi-colon at the end. [1:0.0001:1000]; |
Array Subscripts
Subscripts, or indices, are used to refer to elements at a specified location in an array.
In MATLAB, A(i) is the  th element in the array A and is the index (or position).
You can refer to one or more elements and use these to create new scalar variables or sub-arrays.
|
> Type in the following code and decide which commands create scalars and which arrays. > Check the output and determine the process by which the elements have been selected: A= linspace(5,100,20) A(1) A(7) A(3:6) > Now create two new sub-arrays of A as follows: a4 = A(1:2:13) a5 = A(8:-3:2) > Recall the elements in the sub-arrays as follows: a4(2) a5(1:3) |
Array Functions
| Function | Description |
| sum(Z) | adds all elements of array Z |
| prod(Z) | multiplies all elements of array Z |
| length(Z) | returns the length of array Z |
| [Zmax, i] = max(Z) | returns largest element Zmax of Z and its position, i |
| [Zmin, i] = min(Z) | returns smallest element Zmin of Z and its position, i |
| sort(Z) | sorts elements of array Z in ascending order |
| find(Z>3) | finds the indices of elements of array Z larger than 3 |
Exercise
|
> Create a script M-file called arrayFunctions.m to run the following code, starting by entering comment headers with your name, the date and the purpose of the M-file.
|
Plotting graphs
Last practical we introduced some of the basic plotting functionality, including plotting a straight line and modifying the graph axes, title etc. This week we will look at using arrays to plot functions.
How does the plot command work? Actually, it draws a straight line segment between each set of coordinates that you give it. If the line you are trying to draw is a curve, it will appear smooth by plotting many tiny lines.
Exercise
|
> Create a script M-file called plotArray.m for the following code in order to plot a sine curve between 0 and 2∏. Don’t forget to add comment headers. clear all points = 3 x = linspace(0,2*pi,points) y = sin(x) plot(x,y) > What is wrong with this graph? Change the variable called points to 5 and save before re-running the code, then increase it to 10, 20, 40, 80, 200. Examine each new graph and stop when you think that it is acceptable. |
Variable Editor
Switch to the ‘VARIABLE’ tab to edit your variables/arrays manually. It allows you to edit your arrays and variables in a spreadsheet environment.
> Press Open icon to choose a variable or an array. Otherwise simply double click on the name of the variable or an array you wish to edit in your Workspace Window. A new window named ‘Variables - <name of the variable>’ will be opened. Change any value and see what happens in the Workspace Window and in the Command Window which moved below the new window.
> Choose any of your existing arrays. Plot a graph by highlighting the cells that you wish to plot and then click on the graph button in Plot tab at the top of the grey coloured area. You can choose from a range of plots by clicking the corresponding icon.
> To switch off Variable Editor close the window named ‘Variables - <name of the variable>’.
One-Dimensional Operations
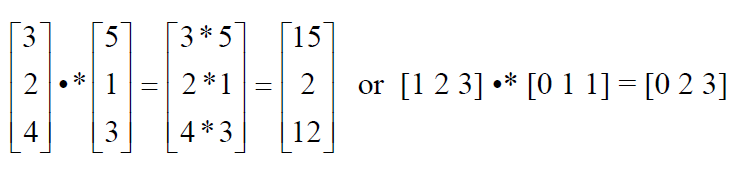
MATLAB has a specific array or ‘element-by-element’ multiplication, •*, designed for one-dimensional arrays, that is also called ‘Hadamard product’ in mathematics, and uses a dot, •, before multiply sign, *, eg V1•*V2
Exercise: Multiplication with Arrays
|
> First define A=linspace(0,5,11) and B=linspace(1,6,11), c=4, and d=-1 |
|
> Find out what happens if you run the following equations: A*c+d A*c+d*B > What happens if you multiply? A*B Note: MATLAB sends you an error message that ‘Matrix dimensions should agree’. It means that you forgot to use a dot before the multiplication sign. Matrix multiplication MATLAB referred to will be taught in further courses. > Try it again with a dot to perform array multiplication: A.*B |
|
> Type in the following commands to find out which one works. A*5 A.*5 5*A A/5 5/A 5./A A^2 2^A 2.^A
|
Array Multiplication Expressions
Table of Array Multiplication Expressions Involving a Dot Before Operator
| A.*B | multiplies corresponding elements of A and B |
| A./B | divides corresponding elements of A and B |
| 5./A | divides 5 by each element of A |
| A.^B | calculates A(i)^B(i) for every corresponding element in A and B |
| 2.^A | finds 2^A(i) for every element of A |
| A.^3 |
cubes each element in A |
Debugging
The following exercise use code sections, also known as code cells or cell mode in the M-file environment to break code into smaller sections. A code section contains lines of code that you want to evaluate as a group in a MATLAB script, beginning with two comment characters (%%). You can run each section and find the errors independently. Such a procedure is called debugging.
|
> Use the cell mode environment by following these steps (making sure you update the comment headers first): 1. Open new M-file in the Editor tab. 2. You may like to dock the M-file Editor in the Command Window area by clicking Dock option in Editor window’ Actions button. In this case you can see your code in the Editor window and its execution results below in the Command window. 3. Type the code. |
| Cells or sections are marked by the double percent sign- %% and each cell has been given a title. You will notice that when you click on a cell, the text is highlighted in yellow. |
|
4. Click on the first cell and execute it by pressing the Run Section button. 5. Correct and re-run the first cell. 6. Go through each of the following cells and debug it. You can choose a cell either by clicking on Advance button or simply by clicking the cursor within the cell you want to debug 7. After debugging this exercise, go to Publish tab. Press on Publish button to publish your script M-file as an HTML Document. You will probably find you have some unnecessary output. 8. Close the output window. Add in semi-colons at the end of lines with unwanted output in your M-file before republishing. |
|
Notes on publishing: Comment lines starting with the double percent %% will be formatted as headers. Additional comment lines will be treated as text. MATLAB commands will be formatted as code. Command Window and graphical output will also be included. For further information, type in the Search for documentation bar ‘Publish MATLAB code’. |
Exercise code
%% Practical 3 debugging exercise
% Add your name and student ID here
% Remember you can suppress output by adding the ;
%% Part 1
% Create an array that contains the cubic roots
% of all elements of array A
clear all
A = [0 1 8 27 64]
cubic_root = A^(1/3) % **** There is a dot missing here
%------------------------------------------------
%% Part 2
% Plot & sum an array containing the series 1/n^2
% for integers from 1 to 100
clear all
x=[1:100]
y=1/x^2 % **** There are two dots missing here
plot(x,y)
sum(y) % The answer should be 1.6350
%------------------------------------------------
%% Part 3
% Conjecture that the limit of sin(x)/x = 1 as x -> 0
% by evaluating sin(x)/x for x = 0.1, 0.01,., 0.00000001
% Find the positions where it is 1 for the given precision
clear all
format long % uses 16 digits for each value
x=0.1^[1:8] % **** One dot missing here
y=sin(x)/x % **** One dot missing here
error = 1-x(8)
c=find(y>=error) %finds indices of elements of array that are bigger
%than defined value of error
plot(x,y)
%------------------------------------------------
%% Part 4
% Find out why this code is not working
% Update the value of maxX to make it work properly
clear all
maxX = 9 % change this value
X=[1:2:maxX]
Y=[10:-1:1]
X+Y
%------------------------------------------------
%% Part 5
% Find the sum of the series (n+1)*n^(1/3)
% for n = 1 to 100
% Your answer should be 2.047524258847828e+004
clear all
n_plus_1 = [2:101]
n_cubic_root = [1:100]^(1/3) % **** One dot is missing here
% note that the above line is a shorter version of part 1 sum_of_series = sum(n_plus_1*n_cubic_root) % **** add dot for the %array multiplication
Questions?
You may also wish to discuss these questions within the Practical 3 forum, also embedded below. If you think you know the answer, you are welcome to respond.
Submit
Please submit your response to Practical 3 for feedback (also embedded below). Use this word document as a template.