MATLAB Project - Slotted Arm
| Site: | learnonline |
| Course: | MATLAB |
| Book: | MATLAB Project - Slotted Arm |
| Printed by: | Guest user |
| Date: | Tuesday, 26 May 2026, 6:50 AM |
Description
MATLAB Project - Slotted Arm
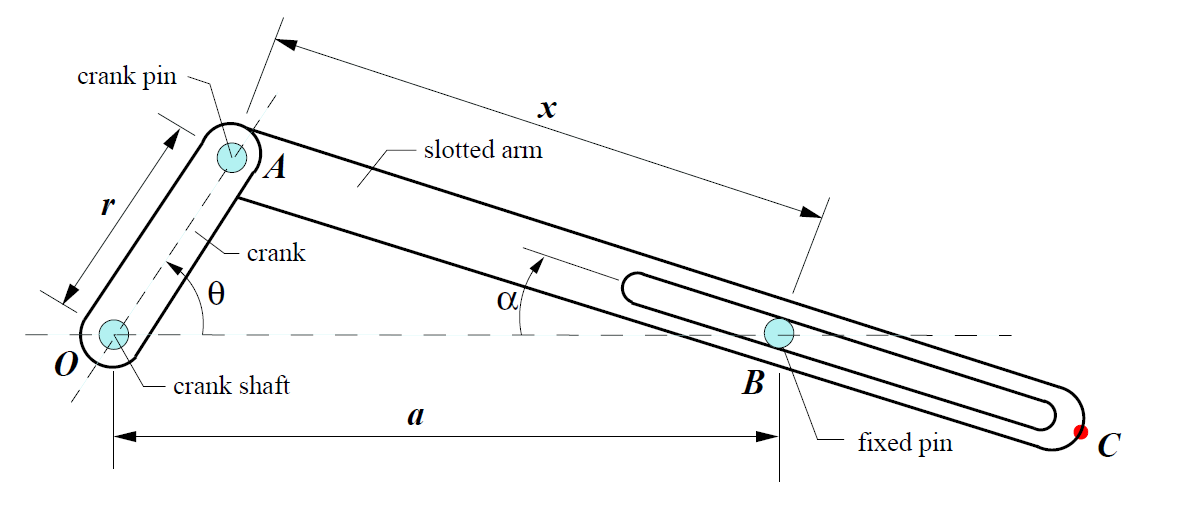
Slotted-Arm Mechanism
Consider the crank-driven slotted-arm mechanism illustrated in the diagram. The crank OA revolves counterclockwise about the fixed point O at five revolutions per second. The length OA is r = 20 cm. The driven link AC of length 85cm is a slotted arm constrained by the fixed pin B at a distance a = 60 cm from O. At any given instant, let the angle of rotation AOB be denoted by θ, the corresponding angle ABO be denoted by α and the distance AB be denoted by x. Assume the angle θ = 0 at time t = 0.
Project tasks
There are 5 project tasks to be completed as part of this project.
You will be working collaboratively to solve these and will be working in a wiki (and forum) to complete your report.
1. Produce
Produce the following commands in a Matlab m-file named simulate.m, and then run
it.
% This program simulates the mechanical system defined in device.m
figure(1);
for t=0:0.002:0.4;
theta=10*pi*t;
alpha=atan(sin(theta)./(3-cos(theta)));
% find coordinates of A
Xa=20*cos(theta); Ya=20*sin(theta);
% find coordinates of C
Xc=20*cos(theta)+85*cos(alpha); Yc=20*sin(theta)-85*sin(alpha);
axis([-20 105 -40 40]);
axis(’equal’);
axis manual; %(*)
hold on;
plot([0 Xa],[0 Ya],’b’);
plot([Xa Xc],[Ya Yc],’r’);
plot([-20 105],[0 0],’k:’);
text(-1.5,-1.5,’O’); text(58.5,-1.5,’B’)
hold off;
pause(0.01);
clf; %(*)
end;
2. Describe
Describe the meaning and purpose of every non-comment line in the M-file simulate.m.
In particular, explain why it is necessary to include the lines ending with %(*). What happens if they are omitted? (Try and see!)
3. Derive
Use a diagram to derive the expressions in the above M-file for the angle α and the coordinates of C relative to the origin O.
4. Max and Min
Briefly explain why it is obvious that the maximum value of XC occurs when t = 0, whereas the minimum value occurs at t = 0.1. Hence, what are the right-most and leftmost coordinates of C?
5. device.m
Write an M-file named device.m which
- sketches the graphs of the angle α(t) and the distance x(t) (on separate plots) over two cycles starting at t = 0 .
- determines the first two times when the angle α = 15◦.
- plots the graph of the angular acceleration, α(t) [radians/sec], over two cycles starting at t = 0, and determines its maximum value.
- plots the path (using equal axes) travelled by the point C. (Its right-most and leftmost points should correspond to your answers in Question 4.)
- finds the coordinates of the lowest point on the path taken by C.
Group Spaces
A forum and a wiki exist for your group to work in to complete the project. These spaces are private to you and your group members. The spaces will be ready for your groups to use about a week after you commence your studies.
You will also be able to hold 1 or more real time meetings with your group members using a virtual classroom environment.
The Groups are:
| Red | Blue | Green | Yellow |
| name | name | name | name |
| name | name | name | name |
| name | name | name | name |
Group Forum
also embedded below.
Group Wiki
Assessment Questions?
The project counts for 10% of your grade. The marking will take into account
- your documentation of the analysis of the problem,
- your MATLAB programs,
- your MATLAB output,
- the correctness of your solutions, and
- the presentation of the whole report.
If you have any questions about how you will be assessed, please raise them in this MATLAB Project forum, also embedded below.
Submission
Your work is to be presented in a group wiki - so instead of submitting, your wiki editing rights will cease to allow your work to be marked.
Wikis are the only way that you can collaboratively generate a product when working at a distance in groups. You are able to add images and other media to the wiki by first giving it a url. An easy way to do this is to make a post to your group forum and add the files as attachments to the forum. You then right click on image to obtain the url, then add to wiki.
The basic layout of the wiki should be
- an opening page with the names of the group members and a table of contents,
- a full description of the main findings of the project, including the derivations and calculations in with appropriate comments on their significance,
- a record of your properly documented M-Files written for the project,
- all required plots, properly labelled.