Measuring health and illness
| Site: | learnonline |
| Course: | Research Methodologies and Statistics |
| Book: | Measuring health and illness |
| Printed by: | Guest user |
| Date: | Thursday, 30 April 2026, 5:43 PM |
Introduction
“Epidemiology is the study (scientific, systematic, data-driven) of the distribution (frequency, pattern) and determinants (causes, risk factors![]() ) of health-related states and events (not just diseases) in specified populations (patient is community, individuals viewed collectively), and the application of (since epidemiology is a discipline within public health) this study to the control of health problems.”1
) of health-related states and events (not just diseases) in specified populations (patient is community, individuals viewed collectively), and the application of (since epidemiology is a discipline within public health) this study to the control of health problems.”1
Basic descriptive epidemiology includes the ascertainment of the person, place and time:
- Who is getting the disease? (i.e., “Person”)
– sex; age; race/ethnicity; occupation
- Where is disease occurring? (i.e., “Place”)
– neighborhood (e.g., disease clusters); latitude (climate); urban vs. rural; national variations
- When did they get the disease? (i.e., “Time”)
– what season; what year (long-term trends)
– elapsed time since exposure
- NOTE: this also called “person, place, & time”
Basic analytic epidemiology involves the ascertainment of causes and effect, or quantification of the association between the exposure and outcomes you are interested in and to test hypothesis about causal relationships.
This introductory module will focus on the (1) measures of disease frequency and (2) measures of association.
References:
- U.S. DEPARTMENT OF HEALTH AND HUMAN SERVICES Centers for Disease Control and Prevention (CDC) Office of Workforce and Career Development. Principles of Epidemiology in Public Health Practice Third Edition, An Introduction to Applied Epidemiology and Biostatistics. October 2006 Updated May 2012 Atlanta, GA 30333. http://www.cdc.gov/ophss/csels/dsepd/ss1978/ss1978.pdf
Measures of Disease Frequency: Basic Measures
![]() The basic measurements in epidemiology include frequencies, proportions, ratios, and rates. Proportion, ratio, and rate measures involve comparison of numerator (cases) and denominator (population) and relates to a population rather than an individual person. Denominator is what differs depending on whether using proportion, ratio, or rate.
The basic measurements in epidemiology include frequencies, proportions, ratios, and rates. Proportion, ratio, and rate measures involve comparison of numerator (cases) and denominator (population) and relates to a population rather than an individual person. Denominator is what differs depending on whether using proportion, ratio, or rate.
Frequency. This is the simplest form of quantitative measure is a count. This is the number of individuals who meet the case definition.
Proportion (or percentage): The numerator is some portion of the denominator. The denominator is the entire group, and individuals in numerator are always included in denominator. Always expressed as percentage (from 0% to 100%) or proportion (from 0.0 to 1.0).
Example: 20 Asians / 80 total population
Interpretation: Asians represent ¼ of entire population
Or convert denominator to 100 and interpret as %.
Example: multiply numerator & denominator by 1.25. This converts 20/80 into equivalent value of 25/100.
Result: 25/100 – or 25% of population is Asian.
Ratio: This is the comparison of 2 quantities. The numerator is divided by denominator. BUT … individuals in numerator are not included in denominator.
Example: ratio of women to men in population
40 females / 20 males
Equivalent interpretations:
There are 40 females for every 20 males
Women outnumber men 2 to 1.
Rate: Major measure used in epidemiology. Frequency with which disease, illness, or other event occurs in defined population during specified period of time. Numerator is the number of cases or events. For ex: number of deaths; number of cases of disease; number of injuries; etc. Denominator is the population, group of individuals, etc
It is IMPORTANT to note that individuals in denominator MUST have potential to be in numerator. That is, people in population (denominator) must have chance of having disease or illness (numerator). Rates (instead of raw numbers) are used because rates adjust for differences in size of populations.
It is also important to note that a large denominator is needed to calculate a reliable rate. For example suppose infant mortality is 20%. This seems like an alarmingly high number, but if the rate was based on 2 observed infant deaths for 10 births the death of 1 infant has a huge impact on the rate and therefore it is unreliable.
Example: Mortality rate during 2008 = # deaths/ total population
If result is 3.8, this suggests that mortality rate is 3.8 per 100,000 people (or some other measure of population).
Rates are generally expressed per 1,000, per 100,000, or per 1 million population. And you can multiply the rate by an amount to yield desired denominator
Example: If 3 deaths in 10,000 population and want to express rate as deaths per 100,000; multiply numerator & denominator by 10
Result: 3 deaths per 10,000 population same as 30 deaths per 100,000 population (also same as 300 deaths per million population).
Need to specify (a) time period and (b) population measure to make rate meaningful. For example, the value of rate per 1,000 is very different from rate per million. Or the rate may be different if for 2000 vs. 2004 vs. 2008 vs. any other year.
Sample Numeric Calculations
![]() Calculations are for some specified time period.
Calculations are for some specified time period.
1. Calculating a Proportion
|
# Deaths |
Population |
|
|
Whites |
20,000 |
220,000,000 |
|
Nonwhites |
14,000 |
125,000,000 |
|
TOTAL |
34,000 |
345,000,000 |
- Question: What proportion of all deaths is by those who are white?
- Answer: 20,000 / 34,000 = 0.588 (i.e., 58.5%)
– Note: numerator (whites who died) are included in denominator (total # deaths)
2. Calculating a Ratio
|
# Deaths |
Population |
|
|
Whites |
20,000 |
220,000,000 |
|
Nonwhites |
14,000 |
125,000,000 |
|
TOTAL |
34,000 |
345,000,000 |
- Question: How do deaths among whites compare to deaths among nonwhites (i.e., what is ratio of white deaths to nonwhite deaths)?
- Answer:
- White deaths = 20,000; Nonwhite deaths = 14,000
- White deaths compared to nonwhite deaths = 20,000 / 14,000 = 1.43
– Interpretation: 1.43 white deaths for every nonwhite death
3. Calculating a Rate
|
# Deaths |
Population |
|
|
Whites |
20,000 |
220,000,000 |
|
Nonwhites |
14,000 |
125,000,000 |
|
TOTAL |
34,000 |
345,000,000 |
- Question: what is overall mortality rate?
- Answer: Total # deaths = 34,000. Total population = 345,000,000
– Mortality rate = 34,000 / 345,000,000 = 0.0000986
- Multiply by 1,000 for rate per 1,000 (0.0986 deaths per 1,000 population)
- Multiply by 1,000,000 for rate per 1 million (98.6 deaths per 1 million population)
4. Calculating a Rate
|
# Deaths |
Population |
|
|
Whites |
20,000 |
220,000,000 |
|
Nonwhites |
14,000 |
125,000,000 |
|
TOTAL |
34,000 |
345,000,000 |
- Question: what is the race-specific mortality rate?
- Answer:
Among Whites: 20,000 / 220,000,000 = 0.0000909
Among Nonwhites: 14,000 / 125,000,000 = 0.000112
Mortality rates per million population:
– mortality rate among whites = 90.9 per million
– mortality rate among nonwhites = 112.0 per million
Measures of Disease Frequency: Common Rates in Epidemiology
![]() The most commonly used rates in epidemiology to evaluate morbidity are incidence and prevalence. These describe the frequency of disease during a given time period. Mortality rate, also a commonly used epidemiological rate, is a rate used to measure deaths and not morbidity.
The most commonly used rates in epidemiology to evaluate morbidity are incidence and prevalence. These describe the frequency of disease during a given time period. Mortality rate, also a commonly used epidemiological rate, is a rate used to measure deaths and not morbidity.
1. Incidence Rate
Total # new cases of specific disease during time period
Total population at risk during time period
This is the primary outcome of experimental and cohort studies. This is what it is needed for the investigation of causal inference.
2. Prevalence Rate
Total # new AND pre-existing cases of specific disease during time period
Total population at risk during time period
This is the primary outcome of cross-sectional studies. There can be two types of prevalence: 1) the point prevalence for the estimates at a specific time, or 2) period prevalence for the estimates within a range of time.
Figure 1. Comparison of Incidence and Prevalence
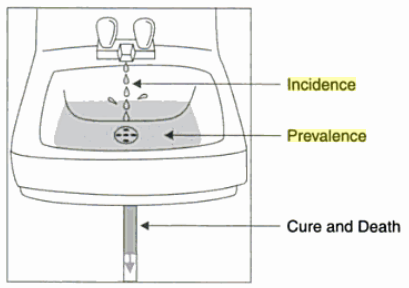
Figure from: Ann Aschengrau & George R. Seage, Essentials of epidemiology in public health.
Notes: Prevalence is like the water collecting in the basin that has all of the cases in the population. Incidence is the water dripping from the faucet, which are the new cases. Death and cures are the output flow from the basin.
3. Mortality Rate
This measure describes the incidence of death/total population at a given time. Typically reported in 3 ways:
i. Crude: One overall rate; no adjustment for other factors. Insert actual (observed) mortality and population values into numerator & denominator
ii. Cause-Specific or Group-Specific: Relevant to particular population characteristics (e.g., specific age group, gender, ethnicity, cause of mortality). Example: infant mortality rate
iii. Adjusted: Rate that has been recalculated to adjust for difference in some population characteristic between sample and overall population or between 2 different samples. Example: age-adjusted mortality rate because sample has disproportionate number of old or young people.
Measures of Association (Measures of Effect)
![]() A measure of association quantifies the relationship between exposure (i.e. risk factor) and outcome (i.e. mortality or morbidity). This is necessary in ascertainment of causes and effect and to test hypothesis about causal relationships.
A measure of association quantifies the relationship between exposure (i.e. risk factor) and outcome (i.e. mortality or morbidity). This is necessary in ascertainment of causes and effect and to test hypothesis about causal relationships.
Examples of commonly used measures association include risk ratio (relative risk), odds ratio, rate ratio, and proportionate mortality ratio. In this introductory module we cover the most commonly reported measures, relative risk and odds ratio.
Figure 1. How to present your study information in a 2X2 Table
|
Outcome |
No Outcome |
Total |
|
|
Exposure |
A |
B |
A+B |
|
No Exposure |
C |
D |
C+D |
To calculate Relative Risk (RR) and Odds Ratio (OR):
– RR=(A/(A+B))/(C/(C+D))
– OR= (A*D)/(C*B)
Relative Risk (RR)
![]() This is the chance that a person who has been exposed to the condition you are interested in develops the outcome in question compared to a person who has not been exposed to the condition developing the outcome. This is typically used in prospective studies.
This is the chance that a person who has been exposed to the condition you are interested in develops the outcome in question compared to a person who has not been exposed to the condition developing the outcome. This is typically used in prospective studies.
If the RR=1, the risk of developing the condition is the same in both groups. If the RR>1 there is an increased risk for the exposed group and a RR<1 means there is a decreased risk for the exposed group.
Example. Smoking (exposure) vs. Lung Cancer (outcome)
|
Outcome- Lung Cancer |
No Outcome- No Cancer |
Total |
|
|
Exposure –Smoking |
15 |
45 |
60 |
|
No Exposure-No Smoking |
6 |
24 |
30 |
RR= Rate of someone that smoked developing cancer/rate of someone not smoking developing cancer = (15/60)/(6/30)= 1.25
Interpretation: The risk of someone who smoked developing cancer is 1.25 (or 25% higher) than someone who did not smoke.
Odds Ratio (OR)
![]()
This is the odds of a person with a disease to have been exposed to a risk factor vs. the odds of a person without the
disease being exposed to that same risk factor. This is used in retrospective studies.
Example. Smoking (exposure) vs. Lung Cancer (outcome)
|
Outcome- Lung Cancer |
No Outcome-No Cancer |
Total |
|
|
Exposure –Smoking |
15 |
45 |
60 |
|
No Exposure- No Smoking |
6 |
24 |
30 |
OR=Odds of someone with cancer having smoked/ Odds of someone without cancer having smoked= (15/45)/(6/24)= (24*15)/(45*6)=1.33
This would be calculated for a case control study (retrospective design).
For More Information on Measures of Disease and Association
![]() Books:
Books:
- Rothman, K. J., Greenland, S., & Lash, T. L. (2008). Modern Epidemiology, 3rd Edition. Philadelphia, PA: Lippincott, Williams & Wilkins
- Gordis, L. (2009). Epidemiology. Philadelphia: Elsevier/Saunders.
- Porta, M. (2014). A dictionary of epidemiology, 5th edition. Oxford, New York: Oxford University Press. Available at: http://www.irea.ir/files/site1/pages/dictionary.pdf
Online Videos and Other Resources
- Principles of Epidemiology in Public Health Practice, Third Edition. An Introduction to Applied Epidemiology and Biostatistics. Available at: http://www.cdc.gov/ophss/csels/dsepd/ss1978/lesson3/section5.html
- Incidence and Prevalence:
- The Relationship between Incidence and Prevalence:
- How to Interpret an Use a Relative Risk and an Odds Ratio: