Derived variables
| Site: | learnonline |
| Course: | Research Methodologies and Statistics |
| Book: | Derived variables |
| Printed by: | Guest user |
| Date: | Sunday, 31 May 2026, 10:21 AM |
Description
asdasd
1. Derived variables
Derived variables ... what are they?!
So what are 'derived' variables? They are variables that you create by calculating or categorising variables that already exist in your data set. An example of a derived variable might be Income Categories, that you would calculate for all of your participants using an existing continuous variable Income.
In this section, we are going to have a go at creating two different kinds of derived variables. The first will be calculating a new variable from existing data. The second will be creating a categorical variable from a continuous variable.
For this exercise, we are going to use income data from the 2016 Health and Society Health Survey to calculate income categories.
STEPS:
1. Open the 2016 Health and Society Health Survey Data.
2. Find the variable that represents monthly income. We are going to calculate a new variable, annual income, from this existing variable, and then categorise the annual income data into income categories.
The income categories we are going to create are as follows:
1: $0
2: $1 to $10,000
3: $10,001 to $50,000
4: $50,001 or more
2. Calculate a new variable from existing data
STEPS:
1. To calculate a new variable, Annual Income, we need to multiply the monthly income by 12:
=incmnth*12.
2. Insert a column next to the variable "incmnth". To do this:
- Right click your mouse over any cell in the column to the RIGHT of where you want to insert your new column.
- In the menu that appears, select "Insert ..."
- In the dialogue box that appears, select "Entire column".
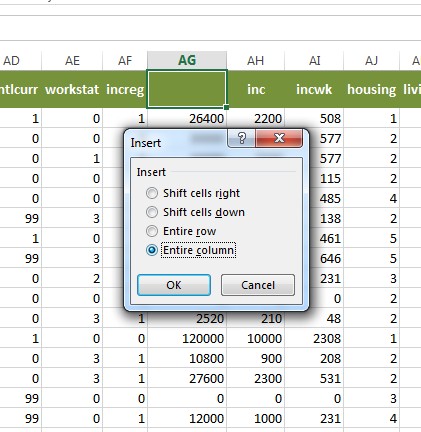
A new column should now appear! Type "incann" in the column heading cell - this will be a new variable for annual income.
3. In the first data cell in the "incann" column, type the following formula:
=[inmnth]*12 (click in the first "incmnth" cell to get the value for [incmnth])
This formula will convert the first persons monthly income to an annual income (monthly income multiplied by 12). If you'd like to decrease the decimal places to zero decimal places, you can do so using the shortcut button on the "Home" ribbon menu:

Then, to fill down this formula (apply the same formula) for ALL participants, select the first cell in the "incann" column, and put your mouse over the bottom right corner of the cell where there is a small black square until you see a black crossbar:
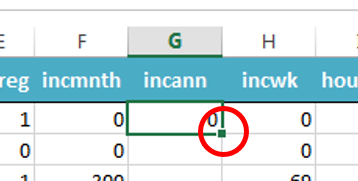
Then, click and drag all the way down to the last participant's cell, and this will fill down the formula (and result) for the whole class.
You have now created a new derived continuous variable from an existing variable in your dataset: annual income ("incann").
3. Create a categorical variable from a continuous variable
STEPS:
Using the new annual income variable we have just created, we are going to create a new variable called "inccat", which will be annual income categorised into groups.
1. Insert a new column next to the "incann" variable column. Label this variable "inccat".
2. For this exercise, we are going to assign and label the income categories as follows:
1: $0
2: $1 to $10,000
3: $10,001 to $50,000
4: $50,001 or more
3. To derive income categories for the new variable "inccat", we will use the variable "incann" and a nested "if" function as follows:
In the first data cell for the inccat variable (in this example, cell "AI2"), you need to type the following formula:
=if(AH2=0,1,if(AH2<10001,2,if(AH2<50001,3,if(AH2>50000,4))))

This formula 'nests' several IF statements within each other, so that you can apply multiple categories for the same variable at once. There are other ways you can do this, and you might decide that you prefer a different way of calculating this, but this formula will get the result we are after, and is relatively simple.
4. Fill down the formula for the entire column, as you did in previous examples. This should mean that all participants have data for the inccat variable.
It is worth having a quick look through your data for this new variable to check whether the formula has actually worked (done what you intended), by checking whether the value in the "inccat" variable actually fits within the income category that has been assigned through the use of the formula.
You should now be able to:
1. Derive new variables from existing variables
2. Create categorical variables from continuous variables in Excel!
4. Grouping data by categories
Now that we have created our new categorical annual income variable ("inccat"), we are going to look at annual income BY living situation (another categorical variable). This is about how to calculate and present categories of one variable by categories of another variable.
STEPS:
1. First you need to make sure you have set up your table in a new Excel worksheet to enter the data (calculations) into. You could set up your table in a format as follows:
Table 1. Annual income categories by living situation for the Health and Society student cohort, 2016 (n=306)
| Living situation | Annual income categories | n | % |
| Live with parents | $0 | ||
| $1 to $10,000 | |||
| $10,001 to $50,000 | |||
| $50,001 or more | |||
| Total | |||
| Live independently | $0 | ||
| $1 to $10,000 | |||
| $10,001 to $50,000 | |||
| $50,001 or more | |||
| Total | |||
| TOTAL |
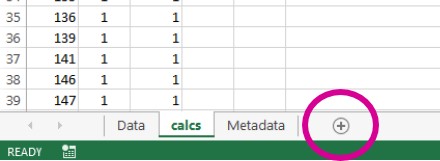
To create a new worksheet, click on the "+" within the circle at the bottom of the Excel window (see figure below).
2. To calculate the number of Health and Society students who are living with their parents AND who do not earn any money ($0 annual income), do the following:
-
-
- Click your mouse cursor into the cell for the 'n' for that group (see figure below):
-
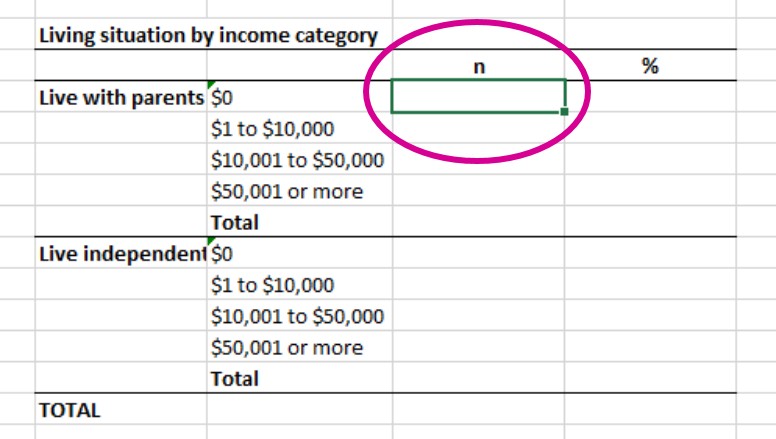
We are going to use a "COUNTIFS" formula to get the count for multiple criteria (i.e., who live with parents AND earn nothing)
-
-
- Type into the formula bar the following formula to get the count for those who earn $0 (category value = "1") AND who live with their parents (category value = "1"):
-
=COUNTIFS([cell range for "inccat"],1,[cell range for "living"],1)
-
-
- Use the same formula to fill out the rest of the n's in the table, changing the category values to match each combination of living situation and annual income category.
-
3. Calculate the percentage for each of the n's in the adjacent column in your table. The denominator should be the TOTAL number of respondents with valid data.
You should now have a complete table.
5. Example table
Here are the values you should have in your table (and an example of what your table could look like):
Table 1. Annual income by living situation of the 2016 Health and Society student cohort
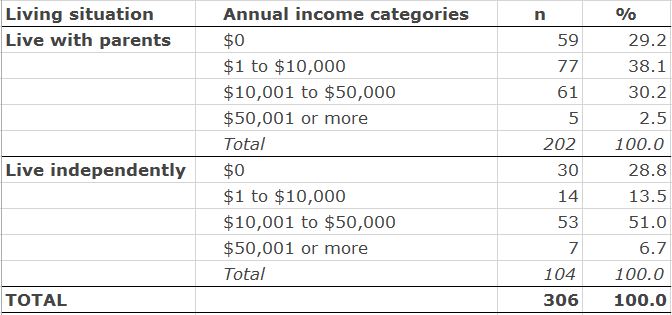
Data source: School of Health Sciences (2016).
Please note that it is not necessary to include the "total" row at the very bottom of the table.
6. Create a graph
In this section, we are going to create a graph of annual income categories by living situation using the data from the table you created in the previous section.
Tasks:
1. See if you can set up your data to create a graph that presents the four annual income categories by living situation (living with parents and living independently), based on the data in your table that you created in the previous section.
2. Spend some time formatting the chart components on the chart you just created, and making sure you have a descriptive graph title, axis labels, units on the y-axis, etc. These small details are all important!!
7. Example graph
Here is an example of how your graph could look:
Table 1. Annual income of 2016 Health and Society students by living situation.
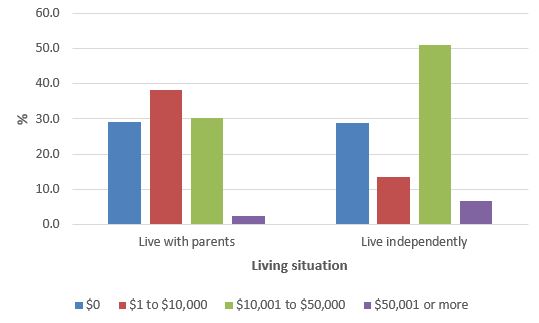
Data source: School of Health Sciences (2016).