8. Symbolic Toolbox
ezplot
If S is s symbolic expression, then ezplot(S,[a b]) graphs the function y = S(x) (or y = S(t)) over the domain a ≤ x ≤ b. If [a b] is omitted, the default domain is −2π ≤ x ≤ 2π. Also, if no title command is used, the default title is the expression S. Of course you are not using arrays and so the dot notation is not applicable.
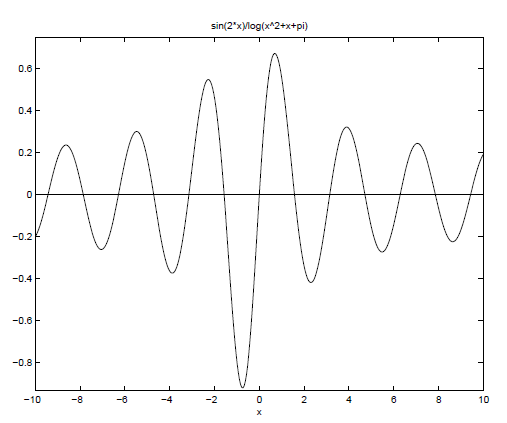
Example: In “Maple”, plot the function y = sin 2x/ ln(x2 + x + π) for −10 ≤ x ≤ 10.
clear all % file available in M-files folder as file8.m
syms x
y=sin(2*x)/log(x^2+x+pi);
ezplot(y,[-10 10]) % notice title
hold on
plot([-10 10],[0 0],’k’) % plot x-axis
hold off