7. Basic data description
Before you can start doing data analyses, you need to familiarise yourself with the data. I like to call this ‘getting to know your data’. There are several commands that help you to understand the characteristics your data. Some of these commands provide similar information and it’s up to you which ones you prefer to use. However, before initiating data analyses, remember to always check the frequencies of all variables, how categorical variables have been coded, the minimum and maximum values and number of missing observations. This is a good way to identify any outliers and potential mistakes in the dataset.
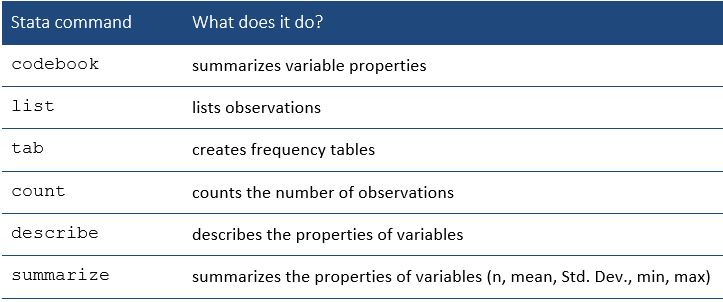
There are several commands for describing your data:
Task: Get to know your data set ![]()
Try typing some of the data description commands:
. count
. describe
. summarize
. codebook
. list
If you want to check the frequencies for a certain variable, type e.g.:
. tab region
If you want to also include the missing values, type e.g.:
. tab region, missing
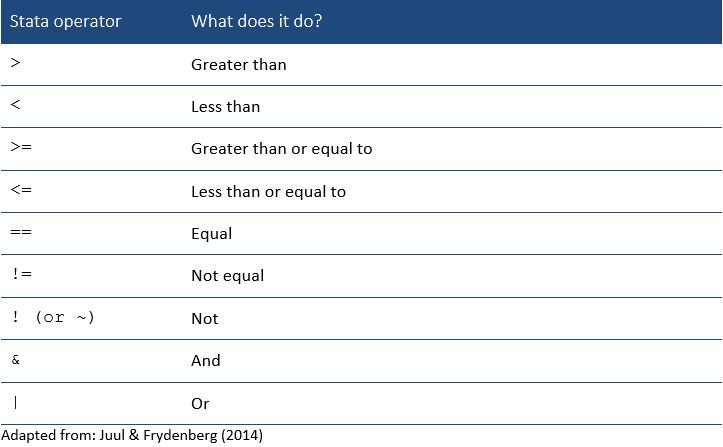
You can combine the data description commands with qualifiers and operators. For example, if is a qualifier which is used to select the observations to which a command applies. Operators used in Stata can be found in the Table below:
Operators in logical expressions:
If you want to list countries with missing information for the variable gnppc (GNP per capita) , type e.g.:
. list country gnppc if gnppc==.
If you want to list countries with life expectancy less than 65 years, type e.g.:
. list country lexp if lexp <65