Correlation
Up until now, we have only considered descriptive statistics for a single variable. However, what if we have two variables and we are interest in whether or not they are associated. In other words, if one variable goes up does the other go up with it? The measure of association we use to demonstrate how to variables are related is called the correlation coefficient – yet another sample statistic.
The correlation coefficient (also known as the Pearson correlation coefficient) measures how well two variables are related in a linear (straight line) fashion, and is always called r. r lies between -1 and +1. A value of r = -1 means that the two variables are exactly negatively correlates, i.e., as one variable goes up, the other goes down. A value of r = +1 means that the two variables are exactly positively correlates, i.e., as one variable goes up, the other goes up. A value of r = 0, means that the two variables are not linearly related.
Figure 5 shows the association between the heights and weights of 100 military recruits. This type of graph is called a scatter diagram.
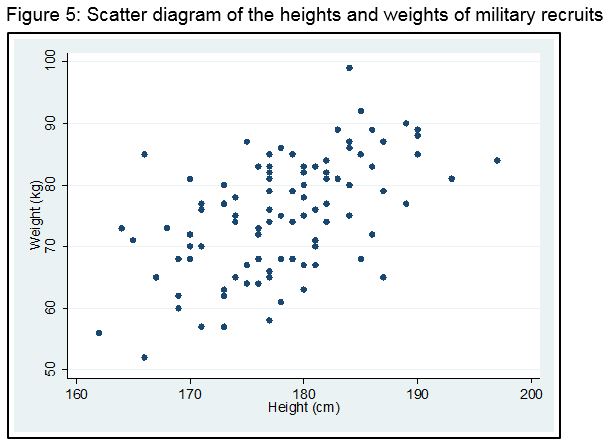
There clearly appears to be a straight line trend between height and weight and the association is positive, that is weight increases with height. In fact for the above data, the Pearson correlation coefficient is r = 0.56.