2. Probability distributions
Example: Consider the following gambling experiment which consists in tossing a piece of coin three times. At each toss, the probability of getting Head is equal to, let say p, the player gains $1 if the face up is Head and loses $1 if the face up is Tail. Consider the variable X, the amount of money gained. Then,
|
Sample space |
x = money gained |
P(X = x): Probability that the variable X takes the value x |
|
H H H H H T H T H T H H H T T T H T T T H T T T |
3 1 1 1 -1 -1 -1 -3 |
P(X = 3) = p3 P(X = 1) = p2 (1- p) P(X = 1) = p2 (1- p) P(X = 1) = p2 (1- p) P(X = -1) = p (1- p)2 P(X = -1) = p (1- p)2 P(X = -1) = p (1- p)2 P(X = -3) = (1- p)3 |
The variable X is an example of a discrete variable and its probability distribution:
|
Values x |
P(X = x) |
P(X = x) for p = 0.5 |
|
3 1 -1 -3 |
p 3 3 p 2 (1- p) 3 p (1- p)2 (1- p)3 |
0.125 0.375 0.375 0.125 |
Definition:
- A probability distribution is a mathematical relationship (rule or model) that assigns to any possible value x of a discrete variable X, the probability P(X = x). This rule is also called probability mass function.
The probability for any particular value is between 0 and 1, that is, 0 ≤ P(X = x) ≤ 1, and the sum of the probabilities of all values must be 1, that is, ∑ P(X = x) = 1.
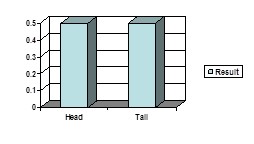
Example:
Experiment of tossing a coin once:
- X=observed result.
- Possible outcomes: {H,T}
- P(X = H) =1/2 and P(X = T) = 1/2
Can be summarized: tables, graphs, formulas
Remark: A frequency distribution, discussed in the context of descriptive statistics, can be considered as a sample analogue to the probability distribution. The appropriateness of the model can be validated by comparing the observed sample frequency distribution to the probability distribution (goodness-of-fit test).