6. Part IV: Describing your data
6.2. Procedure: Crosstabs (and chi-square)
Let’s cross-tabulate smoking status and sex:
1. Analyze > Descriptive Statistics > Crosstabs …
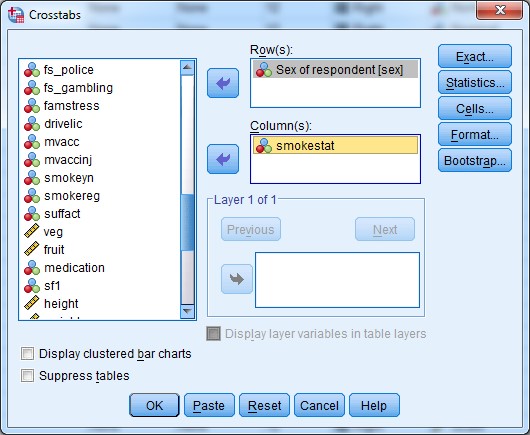
2. In the dialogue box that pops up, place your outcome of interest (smoking) in the columns, and the variable you want to group participants by (to compare one against the other) in the rows (i.e., sex):
3. If we leave it at this, we’ll just get a count of respondents in each combination of categories (e.g., males who smoke, or females who are ex-smokers). But we want to know how to also get a percentage for each group. For this, we need to select the “Cells…” button to the top right of the dialogue box:
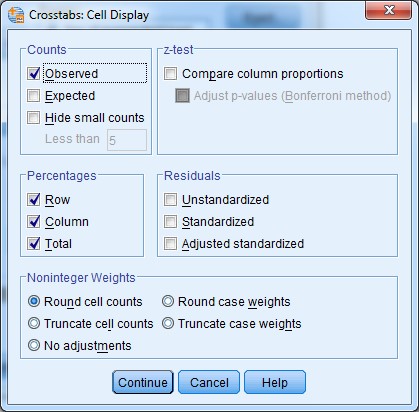
4. Here we can select percentages for rows, columns and total. Let’s select all three then click Continue, then Paste, to paste the syntax to our syntax file for the record.
5. Run selection, then look at your output:
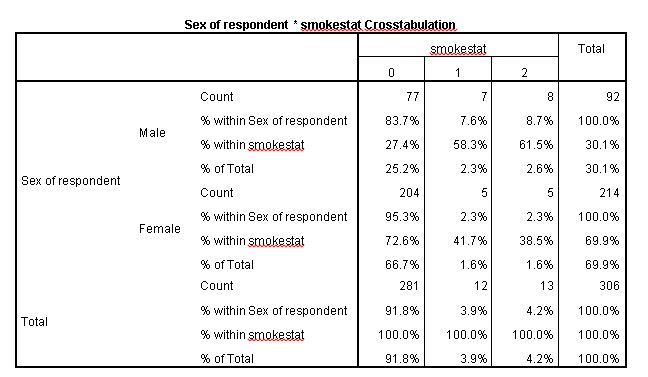
Here we can see it might be useful to label our smoking status value labels, but I can tell you that 0 = Never smoked, 1 = current smoker, and 2 = ex-smoker.
So we can see that in this cohort:
- the majority of males and females (83.7% and 95.3%, respectively) have never smoked;
- a greater proportion of females (95.3%) than males (83.7%) have never smoked;
- a greater percentage of males (7.6%) than females (2.3%) are current smokers; and
- a greater percentage of males (8.7%) are ex-smokers compared to females (2.3%).
It’s also possible to run chi square tests using crosstabs to test whether those differences observed are statistically significant. We can do this through the “Statistics…” option in the crosstabs dialogue box:
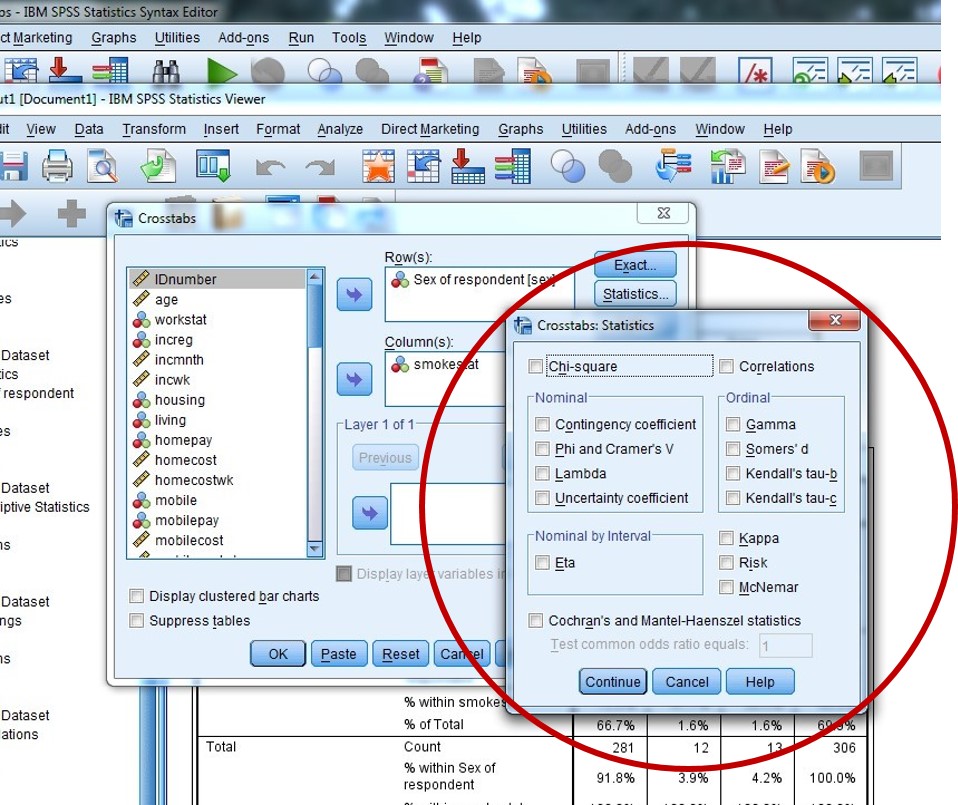
- Tick the “Chi-square” check box at the top left of the Statistics dialogue box, then click Continue.
- Paste your updated crosstabs syntax to your syntax file (don’t delete the previous one!), and run selection.
- In addition to the crosstabs results table you had before, your output should also include another table at the bottom with the results of the chi-square test:
|
Chi-Square Tests |
|||
|
|
Value |
df |
Asymp. Sig. (2-sided) |
|
Pearson Chi-Square |
11.633a |
2 |
.003 |
|
Likelihood Ratio |
10.547 |
2 |
.005 |
|
Linear-by-Linear Association |
10.714 |
1 |
.001 |
|
N of Valid Cases |
306 |
|
|
|
a. 2 cells (33.3%) have expected count less than 5. The minimum expected count is 3.61. |
|||
The Pearson Chi-spare test (top row of data in the table) indicates that there are significant differences between groups, given by the p-value less than 0.05 in the third column of the table.