4. Orientation to the 1025 Study dataset (Excel Workbook)
Key concepts:
-
Cells make up the rows and columns in the spreadsheet. Cells generally hold a single piece of information. -
Rows represent individuals (cases): each row contains one individual's (case's) responses to each survey item (question). -
Columns represent survey items (questions), which we call "variables". -
An Excel "workbook" (file) is made up of one or more "worksheets". -
Metadata is information about data sets (e.g., where did the data come from) and the data contained within them (e.g., what each variable represents and how it is coded in the data set).
For those of you who are not yet comfortable with numeric data ... this is an example of a dataset with text data instead of numeric data:
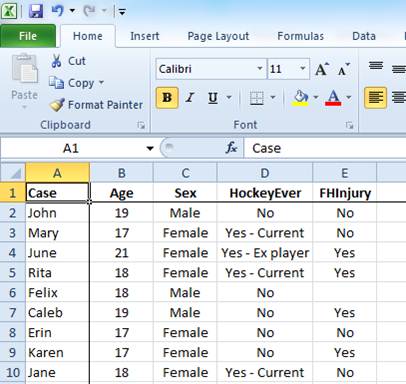
In this dataset, we are looking at a survey of people with regard to their participation in the sport of Hockey, and whether they've had an injury as a result of the sport. It contains information about participant names, ages, sex, whether they have ever played hockey (no, yes I'm an ex-player, yes I'm a current player), and whether they've ever had an injury.
This is straightforward enough, but we can't do any calculations on it, because the data is (mostly) in text format. I can't calculate a count of people who have ever played hockey, nor determine the proportion of males versus females in my survey. To do these things, I need to store this information as numeric data and assign values to response options.
While it can be daunting to look at an unfamiliar dataset for the first time (or first few times!), once you understand what the data represents it will become less scary!
In the "Data" sheet in the 1025 Study dataset, identify the variables (columns) that represent age, sex and height.
Using these variables, we are going to calculate the following :
- mean (average) age of the 1025 Study 2015 cohort and the standard deviation (SD);
- count (number, or 'n'), total count, and proportion (%) of males and females; and the
- mean (average) height and standard deviation (SD) of the student cohort.