4. Grouping data by categories
Now that we have created our new categorical annual income variable ("inccat"), we are going to look at annual income BY living situation (another categorical variable). This is about how to calculate and present categories of one variable by categories of another variable.
STEPS:
1. First you need to make sure you have set up your table in a new Excel worksheet to enter the data (calculations) into. You could set up your table in a format as follows:
Table 1. Annual income categories by living situation for the Health and Society student cohort, 2016 (n=306)
| Living situation | Annual income categories | n | % |
| Live with parents | $0 | ||
| $1 to $10,000 | |||
| $10,001 to $50,000 | |||
| $50,001 or more | |||
| Total | |||
| Live independently | $0 | ||
| $1 to $10,000 | |||
| $10,001 to $50,000 | |||
| $50,001 or more | |||
| Total | |||
| TOTAL |
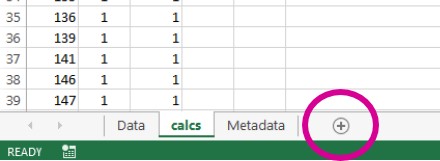
To create a new worksheet, click on the "+" within the circle at the bottom of the Excel window (see figure below).
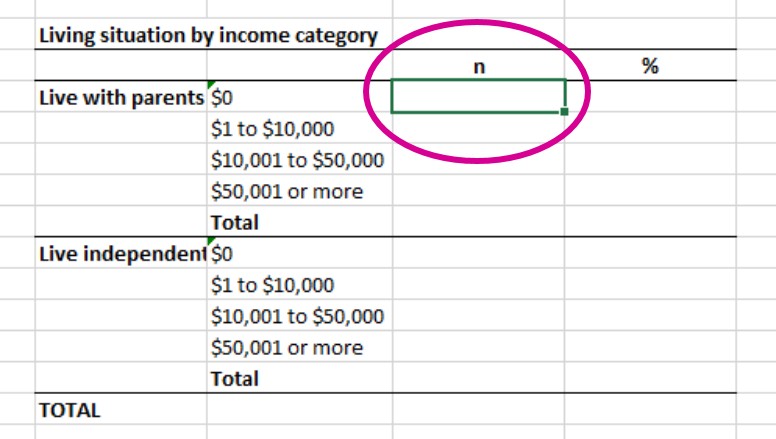
2. To calculate the number of Health and Society students who are living with their parents AND who do not earn any money ($0 annual income), do the following:
-
-
- Click your mouse cursor into the cell for the 'n' for that group (see figure below):
-
We are going to use a "COUNTIFS" formula to get the count for multiple criteria (i.e., who live with parents AND earn nothing)
-
-
- Type into the formula bar the following formula to get the count for those who earn $0 (category value = "1") AND who live with their parents (category value = "1"):
-
=COUNTIFS([cell range for "inccat"],1,[cell range for "living"],1)
-
-
- Use the same formula to fill out the rest of the n's in the table, changing the category values to match each combination of living situation and annual income category.
-
3. Calculate the percentage for each of the n's in the adjacent column in your table. The denominator should be the TOTAL number of respondents with valid data.
You should now have a complete table.