7. Example graph
Here is an example of how your graph could look:
Table 1. Annual income of 2016 Health and Society students by living situation.
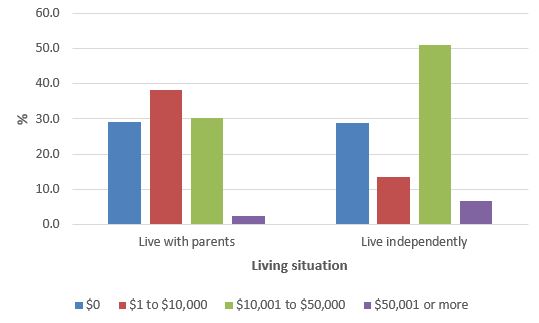
Data source: School of Health Sciences (2016).
asdasd
Here is an example of how your graph could look:
Table 1. Annual income of 2016 Health and Society students by living situation.
Data source: School of Health Sciences (2016).