Spreadsheet analysis
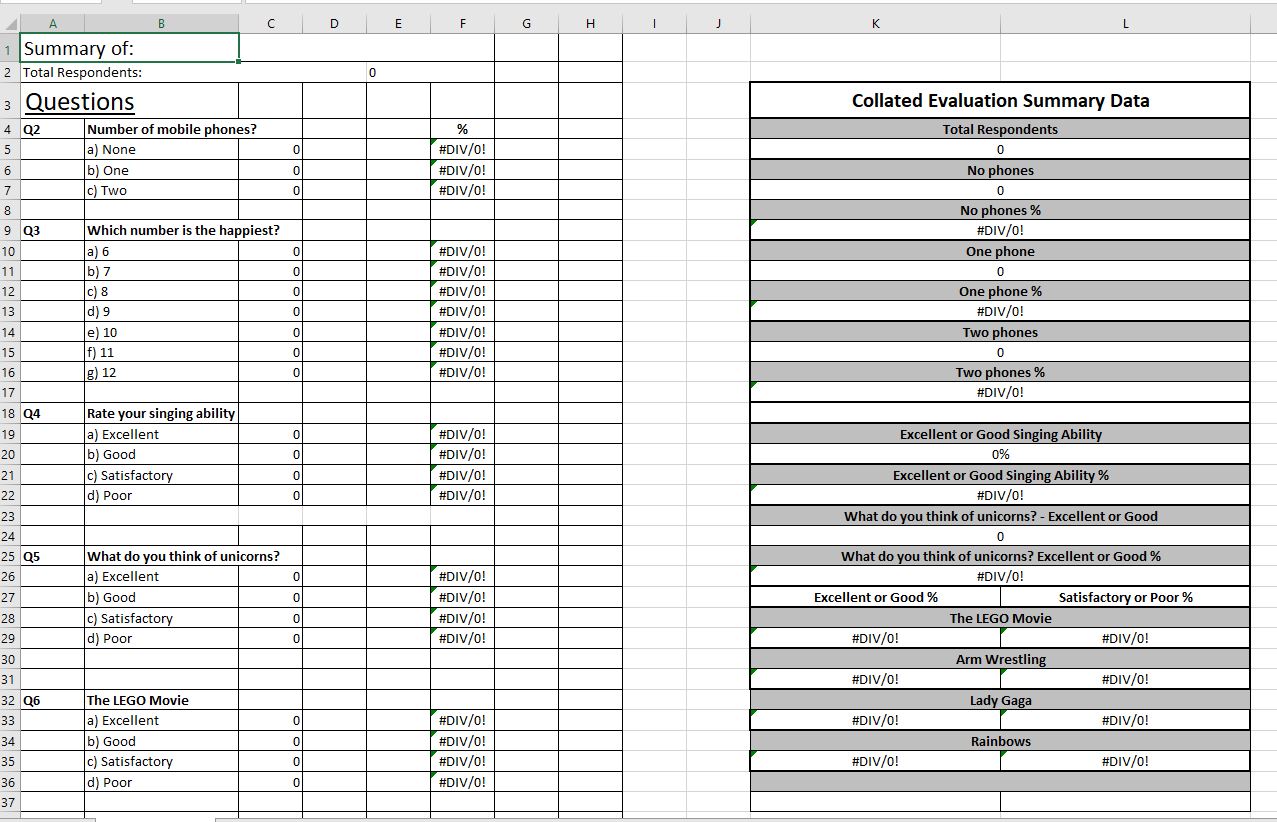
This activity is designed to show you how multiple sheets can work together in a spreadsheet workbook collating results on a summary page.
Open the spreadsheet at this link - Data Analysis Spreadsheet
If you are completing this task at school you could get volunteers to complete the analysis task form and enter the results into the spreadsheet.
If you are doing this online you can use the sample data that has been collected for you. Create three sheets into your spreadsheet, one for each region or cluster.
Sample copies are available here:
Using the above sample data, create 3 sheets, one for each region or cluster. The individual regions will have results on their corresponding sheet and the overall results from all three regions will be collated on the summary page.
The spreadsheet currently accommodates 5 groups. If adding additional groups they will need to be added into the formulas on the summary page.
Can you work out how the formulas in this spreadsheet calculate the results?
Hint: Press Ctrl 'strange button' ('strange button' is found just below the ESC key) to see all the formulas on the worksheet, or you can press F2 to see the formula in a particular cell.