| Ask us |
Tell us |
PMI Chart
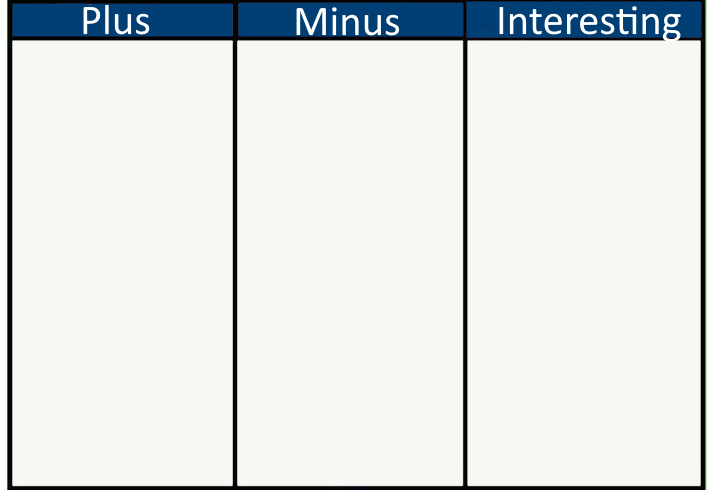
The PMI Chart is a useful too to generate discussion and analysis for complex issues.
The idea is that the entries in the columns can be used as the basis for individual or group learning activities.
- The Plus column is for advantages or strengths or positives.
- The Minus column is for disadvantages or weaknesses or negatives.
- Any ideas which don’t really classify as a plus or a minus can be put into the third column, which can either be for Interesting or for Implications - whichever is more suited to the content.
The PMI Chart is more valuable in discussions about difficult decisions or issues or situations, which have many plusses and minuses.
Download a PMI template (100 KB)
Putting it into practice: Application in Health Sciences
The PMI chart is valuable when examining solutions to scenarios or problem based learning, and to establish what is already known or understood in a scenario.
It is particularly applicable in situations in which students tend to cut their thinking short. They can rush to a conclusion without talking through or coming to grips with the complexity of the issue. Sometimes they ignore information altogether.
A concern about group work in health sciences is how student know that their group conclusions are not incorrect ... even dangerous to their future patients. This is a great way to get reports back to give the teacher oversight of all the discussions.
Activities using the PMI Chart get really interesting when there are a number of groups working on the same scenario, each of them placing their values and emphasis on different things. This can result in a great discussion!


